
A picture, they say, speaks a thousand words. There’s something magical about colourful shapes and lines that make them attractive to human eyes. Homo Sapiens’ love for pictures dates back to the time when our ancestors lived the life of hunter-gatherers.
Below is a painting from Lascaux Cave. It’s estimated that it was created by our ancestors 15,000–20,000 years ago.

The lizard brain inside our skull — that part of our mental machinery which has remained unchanged for millions of years — is pretty acquainted with pictures, images, and colourful shapes. The ability to recognize shapes, lines, and contours gave our ancestors an evolutionary advantage to survive in a hostile environment.
[show_to accesslevel=’almanack-all’]
Which means in the evolutionary time scale, the human brain never had enough time to develop an intuitive sense for numbers. Numbers are relatively a new invention for humans. Historians believe that humans didn’t have to deal with numbers until about 3,000 BC. Yuval Harari, in his book Sapiens, writes —
Between the years 3500 BC and 3000 BC, some unknown Sumerian geniuses invented a system for storing and processing information outside their brains, one that was custom-built to handle large amounts of mathematical data. The Sumerians thereby released their social order from the limitations of the human brain, opening the way for the appearance of cities, kingdoms and empires. The data-processing system invented by the Sumerians is called ‘writing’.
Today, even for a highly qualified mathematician who lives and breathes complex mathematical equations, the reaction towards pictures is far more intense than numbers. It’s hard to fight the force of millions of years of evolutionary inertia.
Until the late 18th century, only a minuscule part of the human population had exposure to basic numeracy. And as far advance maths specialists were concerned (what they called advanced during those days is taught in 5th standard today), you could count such people on fingers.
However, something remarkable happened when a clever guy called William Playfair, a Scottish engineer, transformed economic data into visually appealing pictures. That was the birth of charts. In 1786 he invented the line, area, and the bar chart. And in 1801 he created pie chart and circle graph to show part-whole relations.
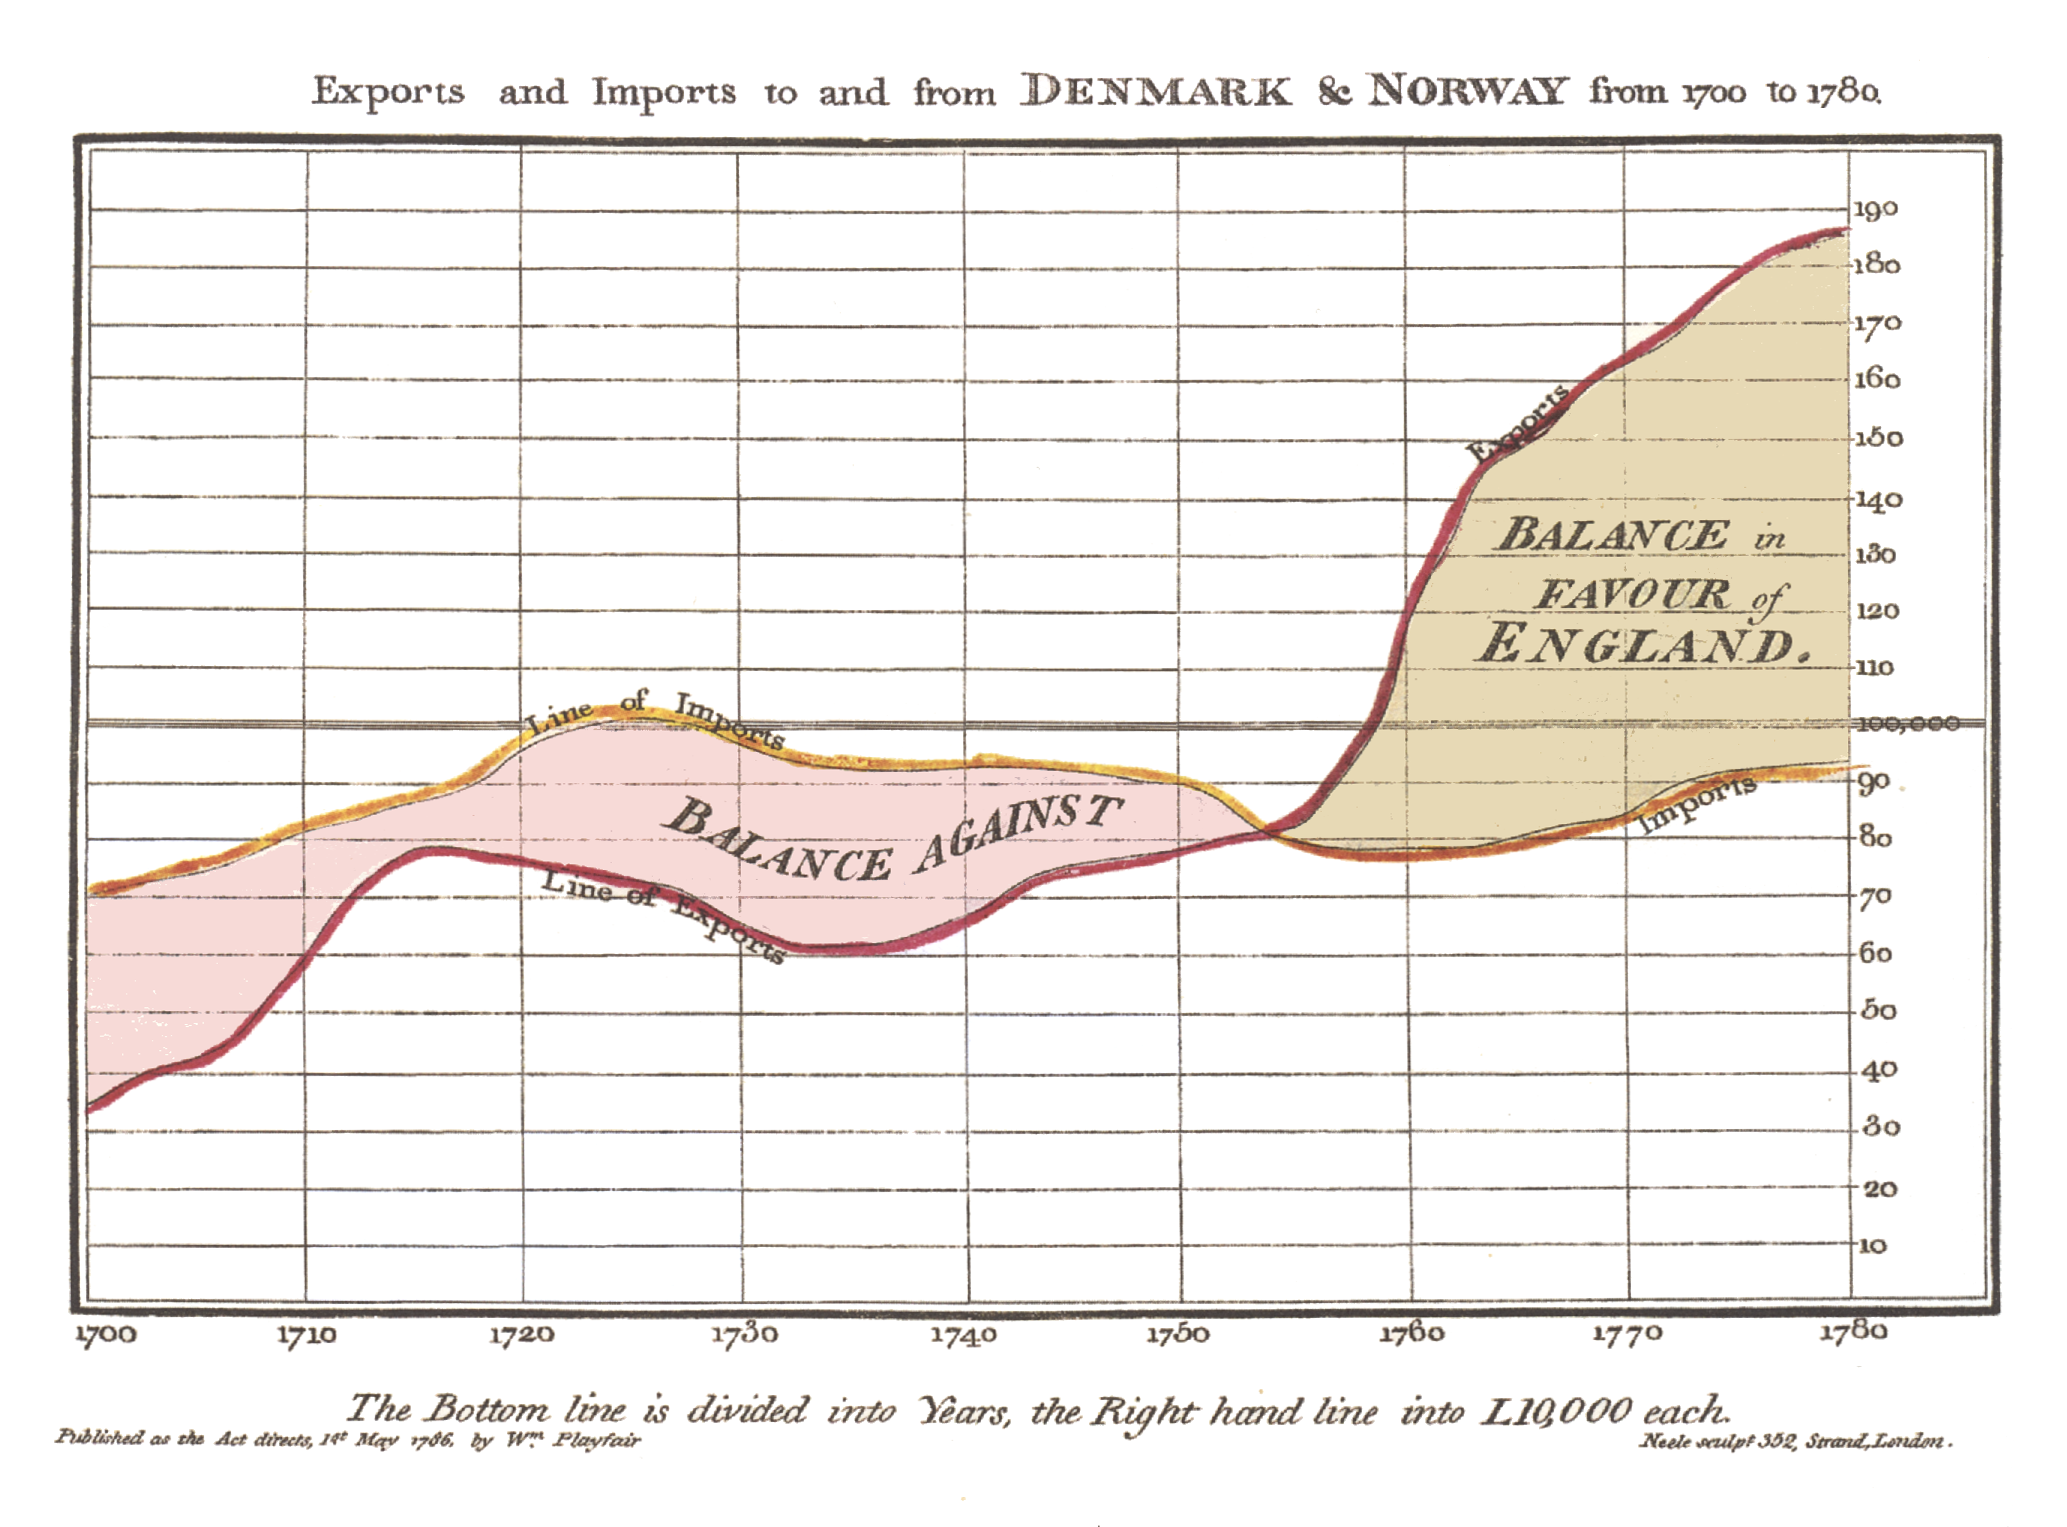
Playfair could be called the father of data visualization. Thanks to Playfair’s inventions, it was perhaps the first time in entire human history when numbers made an impression on amygdala — the lizard brain.
It was good news. But it was bad news too.
The moment you get the lizard brain involved, the so-called animal spirits start interfering. Numbers transformed into lines on the graph can be useful and dangerous at the same time. Useful because the visualization brings greater clarity that number alone can never achieve. Dangerous because it makes the thing represented look more certain than it really is. It bends the sense of reality.
Add money into the mix and it doesn’t take time for things to go from dangerous to disastrous. And what’s the best place to find the combination of charts, money, and animal spirits?
Stock market.
Max Gunther, in his book Zurich Axioms, writes —
The Chartist’s Illusion is often a graphic extension of the Historian’s Trap. This is best illustrated by the chartists of Wall Street. These are people with their own jargon, which hardly anybody else can understand; their own magazines and newsletters, which ditto; and their own starkly visualized illusion of order. They believe that the future price of a stock – or a currency, a precious metal, or anything else for which frequent market-price data are published – can be ascertained by charting price movements of the past.
The chartist begins by fastening his attention on a certain investment medium, let’s say a stock, Hoo Boy Computer. He goes back through months or years of records showing the up and downs in Hoo Boy’s trading price, and he translates these numbers into points and lines on graph paper. He studies the resulting patterns. He looks particularly for jiggles and wiggles that occurred just before Hoo Boy stock began a significant price rise or a sharp drop. He believes these patterns will repeat themselves. The next time he sees a similar set of jiggles and wiggles, he will conclude that a new price rise or drop is on the way and will take the appropriate speculative action.
When things don’t work out as he expects – which, as often as not, they don’t – he will humbly blame himself. The problem, he insists, is that he hasn’t been astute enough. He knows the market can be predicted by charting, if only he can figure out what patterns to look for.
Looking for patterns is an evolutionary trait which helped our ancestors survive in the African savannah. Numbers themselves don’t scream patterns but the moment you draw lines and bars, our eyes can’t help noticing interesting patterns. We don’t realize that it’s the lizard brain acting in survival mode.
Richard Tim, in his book Investing Psychology, writes –
In general, the world is a disorderly place, full of random events. We’re attuned to look for cause and effect because where we find order we generally find human beings at work, turning the randomness of the world into something less perplexing.
So we see that the human brain is massively incapable of differentiating between what’s truly random and what’s not. Most patterns in stock markets are just randomness. Seeking the comfort of familiarity and certainty in the chaos of markets is a fool’s errand.
Gunther again:
…the stock market has no patterns. It almost never repeats itself and never does so in a reliably predictable way. Making charts of stock prices is like making charts of ocean froth. You’ll see each pattern once, and then it will be gone. Only by blind chance will you ever see it again. If you do see it again it will have no significance, for it predicts nothing.
There’s something peculiar about price charts. The smooth curves punctuated by sharp peaks and valleys can turn a bunch of uninteresting and disorderly looking number into an enticing trend.
Such non-existing patterns are often used against naive investors.
The hucksters and con artists of the world have been aware of this power of the chart for centuries, writes Gunther. He adds —
Mutual fund salespeople use it all the time. The value of a fund’s units may have been creeping up so slowly that they haven’t even kept pace with inflation, but by squeezing years close together on a chart page, and perhaps by bridging over some bad years they would prefer not to discuss, the trust’s promoters can produce a honey of a chart for their sales brochure. You look at that soaring black line and say, “Wow!”
The danger is not just that you can be conned by others, but that you can hoodwink yourself. You look at a chart depicting the value of the lira against the dollar in recent years, for instance. The line slopes upward. You think, “Wow! Maybe I ought to climb aboard!”
But wait. Don’t be mesmerized by the line alone. Look at the numbers it is supposed to represent. Maybe it depicts only the lira’s yearly highs. Another chart showing the yearly low might have a downward slope. In other words, the lira-dollar relationship has been marked by increasingly wide swings. The calm, steady change implied by that upward-sloping line is an illusion. The truth is that the relationship is one of increasing disorder.
In the hands of experienced investors, charts are useful tools. But those who are new and unaware can be deluded by charts.
Chartist’s illusion can lead to serious investing mistakes. Don’t let it fool you.[/show_to] [hide_from accesslevel=’almanack-all’]
- Spotlight: Big ideas from Value Investing and why applying them in your investment decision making will be a great deal
- InvestorInsights: Interviews with experienced value investors, learners, and deep thinkers
- StockTalk: Thorough analysis of business models of companies (without any recommendations)
- Behaviouronomics: Deep analysis of human behaviour and how it impacts investment decision making
- BookWorm: Reviews of the best books on Value Investing and related subjects
- Free Course – Financial Statement Analysis for Smart People (otherwise priced at Rs 5,900)
- Archives: Instant access to our huge archive from the past three years