
During World War II, in the middle of 1944, the Allied forces were gaining ground against Germany. With the invasion of Normandy, Germany was on its back foot. In spite of this massive setback, Germany was not ready to let up.
On June 13, 1944, a week after Normandy, a loud buzzing sound rattled through the skies of battle-worn London. Seconds later, a never seen before flying object crashed and exploded on one of the civilian establishments in the city. Dozens perished.
British intelligence soon discovered that it was a new weapon developed by Germany. They called it V-1.
On its debut night, 9 more V-1s were fired across the English channel. Fortunately, only four of them managed to strike England. But that was just the beginning. Over the next few months, Germany shot 13,000 of those V-1s.
[show_to accesslevel=’almanack-all’]
V-1 was a self-propelled flying bomb, guided using gyroscopes, and powered by a simple pulse jet engine. This high-frequency pulsing gave the bomb its characteristic sound. These menacing aerial drones earned a nickname — buzzbombs.
After World War II ended, the U.S. used the V-1 design to develop the first cruise missile.
The sound of a buzzbomb sent a cold shiver down the spine of every civilian in London. Given that the buzzbomb seemed to fly on its own with some kind of autopilot, it wasn’t entirely clear to Britishers how accurate V-1s were. They worried if those bombs were falling haphazardly over the city, or were they hitting their intended targets? Had the Germans really worked out how to make an accurately targeting self-guided bomb?
Imagine that you were part of the British intelligence and they asked you to solve this problem. They hand you a map which shows the points where buzzbombs fell. How would you figure out if the pattern of bombing points were random or not?
In fact, Londoners took upon themselves to figure out a pattern to the bombings. Many people were convinced that certain areas were being targeted and others were being spared, leading to conspiracy theories about German agents in specific neighborhoods that didn’t get hit.
To help you think through the problem given to you by British intelligence, let me show you two images. Take a look at the following pictures. One of them is a randomly generated pattern of dots. Which one is it?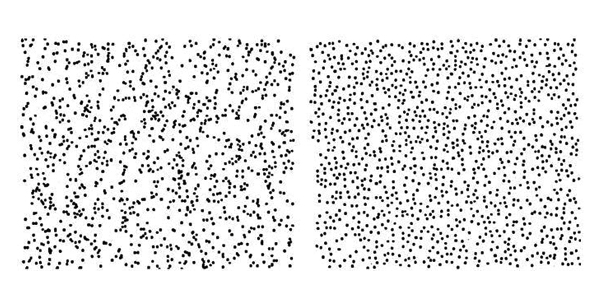 Our intuition tells us that the image on the left cannot be random. The dots seem to cluster around in specific patterns. It’s like stars in the sky. However, it’s the left-image which is randomly generated. The one on the right is a pattern created by glowworms — it records the positions of glowworms on the ceiling of the Waitomo cave in New Zealand. Biologist Stephen Jay Gould discovered it. This image comes from Steven Pinker’s book Better Angels of Our Nature. He writes —
Glowworms are gluttonous and will eat anything that comes within snatching distance, so each worm gives the others a wide berth when it stakes out a patch of ceiling. As a result, they are more evenly spaced than stars, which from our vantage point are randomly spattered across the sky. Yet it is the stars that seem to fall into shapes, including the ram, bull, twins, and so on, that for millennia have served as portents to pattern-hungry brains. Gould’s colleague, the physicist Ed Purcell, confirmed Gould’s intuition by programming a computer to generate two arrays of random dots. The virtual stars were plonked on the page with no constraints. The virtual worms were given a random tiny patch around them in which no other worm could intrude. You can probably guess which is which. The one on the left, with the clumps, strands, voids, and filaments (and perhaps, depending on your obsessions, animals, nudes, or Virgin Marys) is the array that was plotted at random, like stars. The one on the right, which seems to be haphazard, is the array whose positions were nudged apart, like glowworms.
The statistical analysis of V-1 bombings revealed that it was all random. No wonder, out of all the 13,000 buzzbombs which Germans sent across the English channel, only 2419 managed to reach England.
Random data often contains streaks and clusters, writes Gabriel Weinberg, in his book Superthinking, “Are you surprised to learn that there is a 50 percent chance of getting a run of four heads in a row during any twenty-flip sequence? Streaks like this are often erroneously interpreted as evidence of nonrandom behavior, a failure of intuition called the Clustering Illusion.”
Clustering Illusion messes with our ability to appreciate the role of randomness in our lives. Daniel Kahneman, in his book, Thinking Fast and Slow explains —
People expect that a sequence of events generated by a random process [coin toss] will represent the essential characteristics [equal probability of head and tail] of that process even when the sequence is short [few tosses]. In considering tosses of a coin for heads or tails, for example, people regard the sequence H-T-H- T-T-H to be more likely than the sequence H-H-H-T-T-T, which does not appear random, and also more likely than the sequence H-H-H-H-T-H, which does not represent the fairness of the coin. Thus, people expect that the essential characteristics of the process will be represented, not only globally in the entire sequence, but also locally in each of its parts. A locally representative sequence [the sequence of 5 heads which you observed], however, deviates systematically from chance expectation: it contains too many alternations and too few runs.
Another consequence of the belief in local representativeness is the well-known gambler’s fallacy. After observing a long run of red on the roulette wheel, for example, most people erroneously believe that black is now due, presumably because the occurrence of black will result in a more representative sequence than the occurrence of an additional red. Chance is commonly viewed as a self-correcting process in which a deviation in one direction induces a deviation in the opposite direction to restore the equilibrium. In fact, deviations are not “corrected” as a chance process unfolds, they are merely diluted.
Did you know that early iPod users complained that the shuffle playlist feature wasn’t shuffling properly? Apple had to make the shuffle feel more random. Which is paradoxical for any planned tinkering with randomness makes it non-random, isn’t it?
Weinberg observes —
It also explains that uncomfortable feeling you might have gotten as a student when you saw that you had chosen answer B four times in a row on a multiple-choice test.
Typically humans intuitively find it hard to deal with randomness, as a result, we tend to put a tremendous amount of weight on previous events, believing that they’ll somehow influence future outcomes.
More than a century ago, on August 18, 1913, a casino in Monte Carlo had an improbable run of twenty-six blacks on a roulette table. What are the odds of that? 1 in 137 million!
Imagine what must have been going on in the minds of those who were trying their luck on that table that day? When the the roulette ball must have rolled on black a half dozen times, everybody was probably convinced that the next one would be red, right? They kept betting against black and kept losing money. They forgot that the roulette didn’t have any memory.
Expecting that the future events will smoothen out the stock prices, just because it has been falling for ‘n’ consecutive trading days, is an irrational way of thinking.
In the stock market where the stock price movement in the short run is mostly random, it’s a surety that someone looking for a pattern will find one in the price charts.
[/show_to]
[hide_from accesslevel=’almanack-all’]
- Spotlight: Big ideas from Value Investing and why applying them in your investment decision making will be a great deal
- InvestorInsights: Interviews with experienced value investors, learners, and deep thinkers
- StockTalk: Thorough analysis of business models of companies (without any recommendations)
- Behaviouronomics: Deep analysis of human behaviour and how it impacts investment decision making
- BookWorm: Reviews of the best books on Value Investing and related subjects
- Free Course – Financial Statement Analysis for Smart People (otherwise priced at Rs 5,900)
- Archives: Instant access to our huge archive from the past three years